Are Covid Deaths under-estimated in second Wave?
There have been widespread allegations that Covid deaths have been over-estimated in the second wave of the pandemic in India. Data from certain towns has been produced, showing under estimation by a factor of 10 to 100 times. This note compares the two waves and uses the difference to put an upper limit on the underestimation.
Scholar from across the World have argued that COVID cases and deaths have been underestimated across the World and that the degree of underestimation is greater in developing countries than in developed counties. This note does not address these broader issues but focuses on the potential increase in the degree of under-estimation during the second wave relative to the first wave.
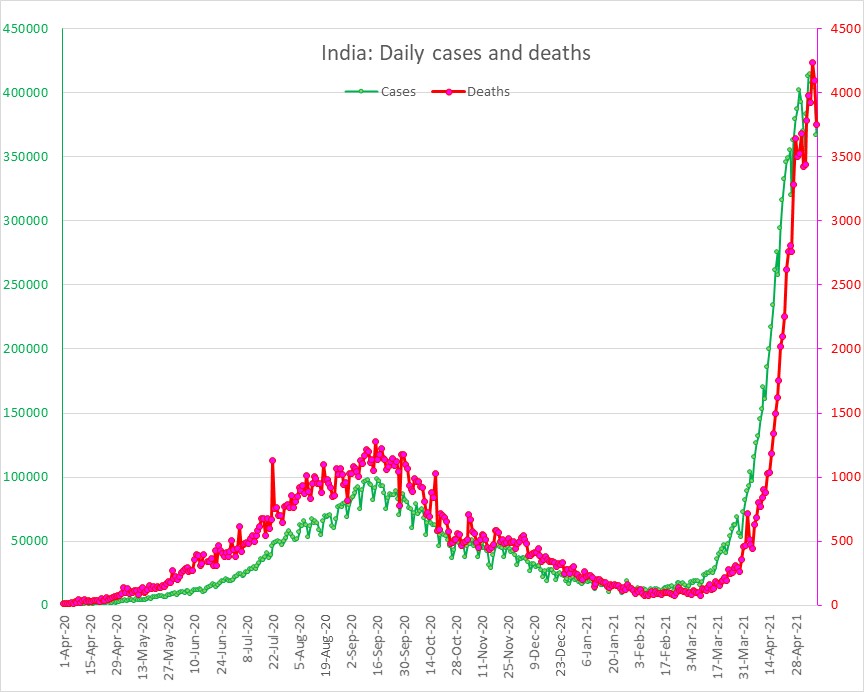
Figure 1 plots the cumulative cases and deaths till May 9, 2021. Cases are on the left-hand scale and deaths on the right-hand scale. The curve of cases is lower than the curve of deaths in the first wave, but vice versa in the second wave. More undercounting during the second wave, is a possible explanation for this change in pattern.
We assume that the first wave ended on the date at which the rate of growth of cases reached a trough on 14th February 2021. For simplicity, the cases and deaths up to February 15th are attributed to the first wave and after that to the second wave. The data is presented in columns 4 & 5 of the table. We then calculate the Test positivity rate as the ratio of Cases to Tests and the fatality rate as the ratio of deaths to cases. These are shown in columns 2 and 3. It is clear that the test positivity rate in the second wave (12.7%) is more than double that in the first wave (5.3%). In contrast the fatality rate in the first wave (>1.4%) is about 1.5 times that in the second wave. This differential Is used to estimate the potential undercounting. On this basis the total number of deaths as of 26th May is estimated to be 2.4 lakhs relative to the official estimate of 1.6 lakhs (columns 6 & 5).
Table1: Cases and deaths in two waves
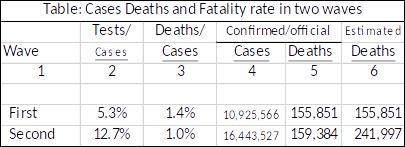
Figure 1: India COVID cases and Deaths
Estimating Covid Wave Deaths II
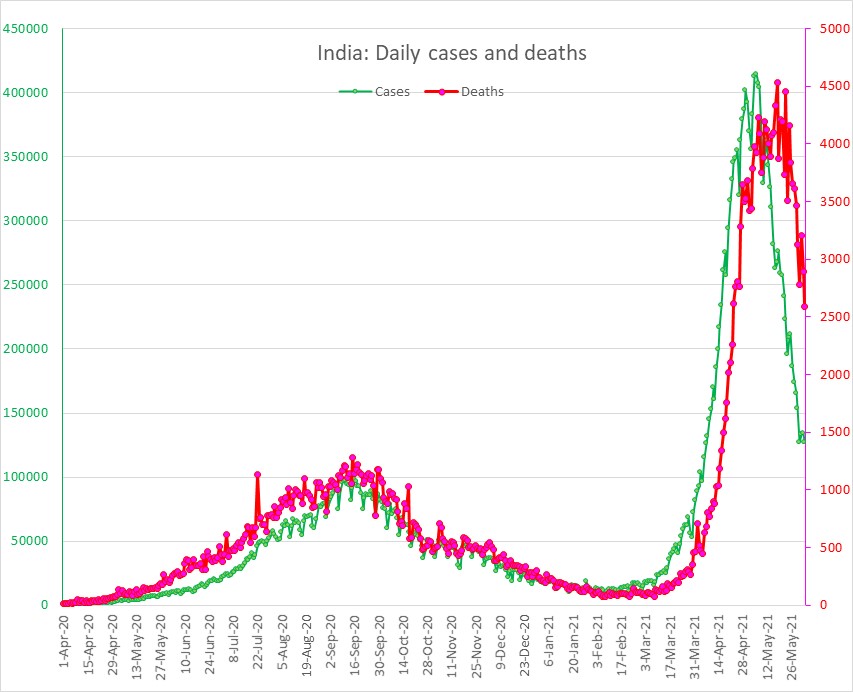
With data available for the whole of May 2021(up to Jue 3), we revisit the issue of underestimation of Covid deaths at the start of the second wave, given the explosive spread of the virus, unprecedented rise in severe cases and the overwhelming of hospital facilities and the health infrastructure in many cities. Figure 2 shows that the anomaly of case curve (green, left scale) lying above the death curve (red, right scale) which prevailed during the rise in cases has now been corrected as number of new cases starts to fall.
Figure 2: India COVID cases and deaths
We divide the analysis into following periods: (1) The period between the first wave start to peak of active cases, (2) From this first wave peak to trough of active cases, (3) the period from first wave trough of active cases to the second wave peak, (4) From the 2nd wave peak of active cases to the latest available data (June 3, 2021). A similar periodization is done using the rate of growth of cases to define peaks and troughs. The difference in fatality rates between period one and period 3 is used to adjust for the deaths in the second wave. There is no anomaly between period (4) and period (2). On the contrary the fatality rate is higher in the latter.
The differential in fatality rates between the rising phase of the second and first waves is used estimate the underestimation during the second covid wave relative to the first wave. The estimates are given in table 2. Columns 8, 9, 10 give the cumulative value of tested, confirmed cases and deaths (as per official numbers). Columns 4, 5 & 6 give the increase in tested, cases and deaths during the seven periods defined above(4 + 3 more in terms of case growth rates). Column 7 gives the adjusted death rates. The rows marked 3a and 3b are the ones in which our estimates of death are higher than the official numbers.
On a cumulative basis, we find that deaths have been underestimated by 17% during the second wave (last row, table 2)
Table 2: Underestimation of deaths in second wave relative to first.
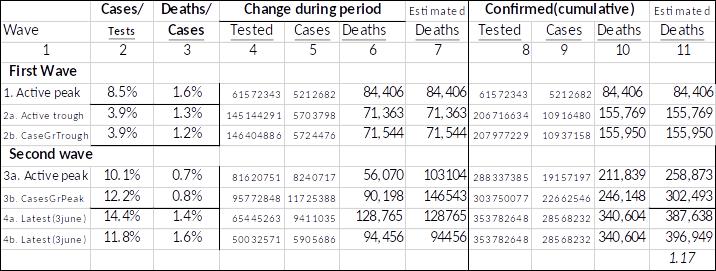
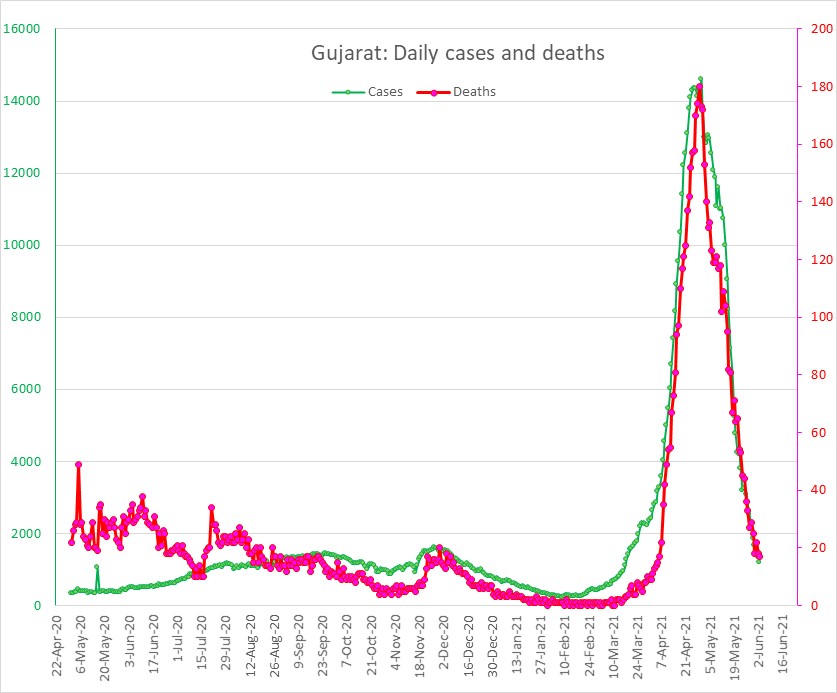
Table 3 compares the key ratios calculated by us for a few key States. Surprisingly, there is no underestimation of the fatality rate in the cases of Gujrat, while Maharashtra has a discrepancy (4.4) which is more than twice the all India one (1.6). Maharashtra’s underestimation of total deaths as of June 3, 2021 of 30%, a little less than twice the all India average of 17%.
Figures 3 and 4 illustrate the contrasting cases of Maharashtra and Gujarat: When we compare the first and second waves, the pattern of deaths relative to cases is quite different in the case of Maharashtra, while the patterns are remarkably similar for Gujrat. A comparison with all India patterns (figure 2) further confirms why Maharashtra is much worse and Gujrat much better. Note however, that this note assumes there is no (statistically significant) difference in reporting of cases, between the second and first waves.
Table 3: Ratio of estimated to official deaths.
Deaths are adjusted for Covid fatality rates (only)
Figure 3: Maharashtra cases and deaths
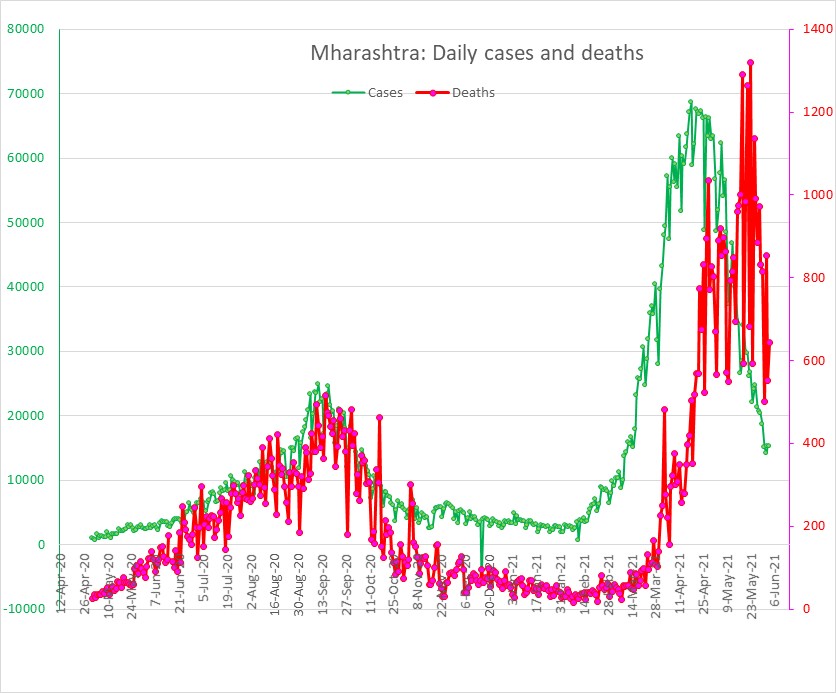
Figure 4: Gujarat cases and deaths
Conclusion
Our analysis suggests that most of the underestimation of deaths occurred during the phase of explosive spread of mutated variants. The entire system from clinics and hospitals to crematoriums was suddenly overloaded and overwhelmed. The fatality rate during this Phase was therefore underestimated by 60% on average at all India level. However, the underestimation was as high as 300% in Maharashtra. After adjusting for this under-estimation, we find that the overall COVID related deaths were under-estimated by 17% as of 3 June 2021. In the case of Maharashtra this meant an under-estimation of total deaths (as of 3rd June) by 30%.
Appendix:
Figure 5: Madhya Pradesh cases and deaths
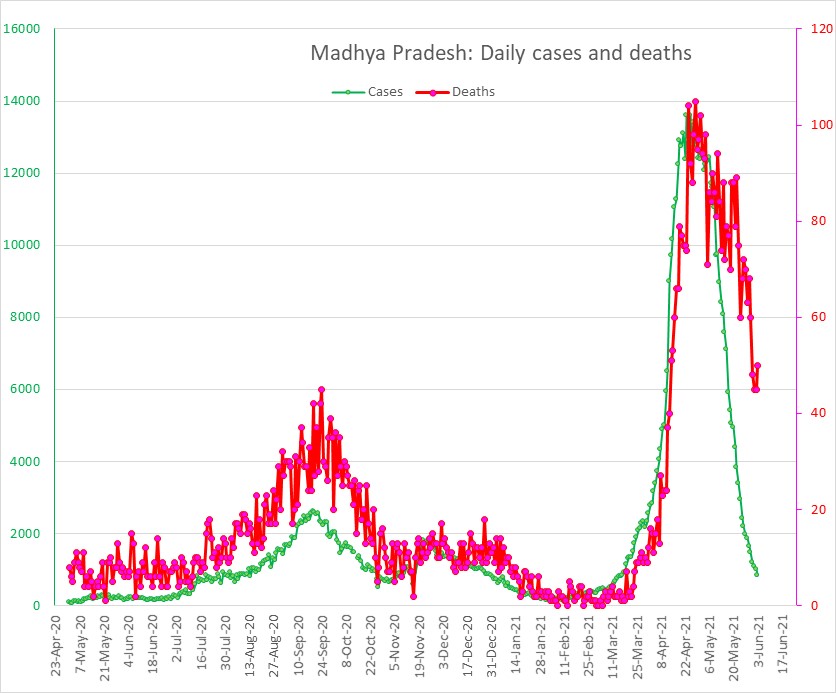
Figure 6: Andhra Pradesh cases and deaths
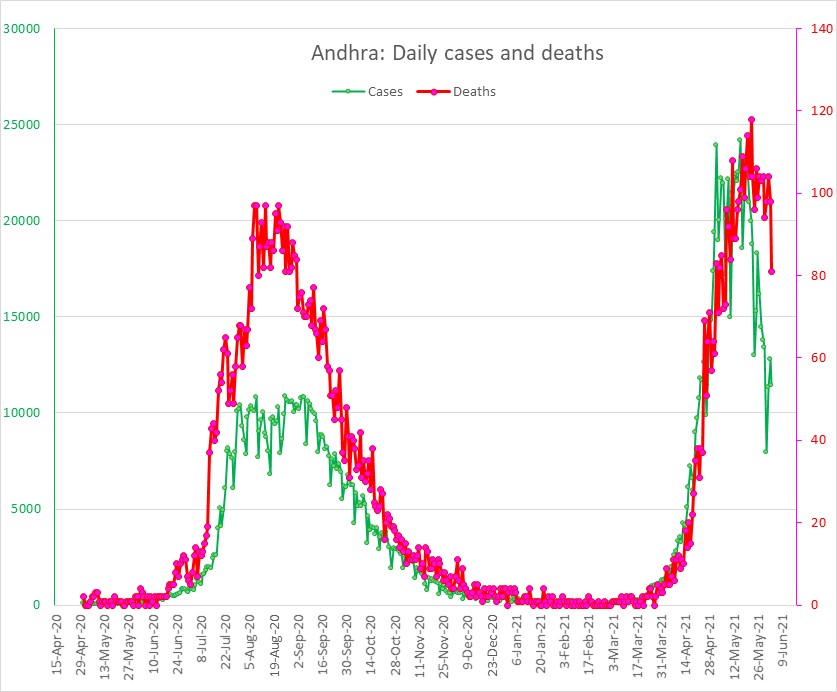
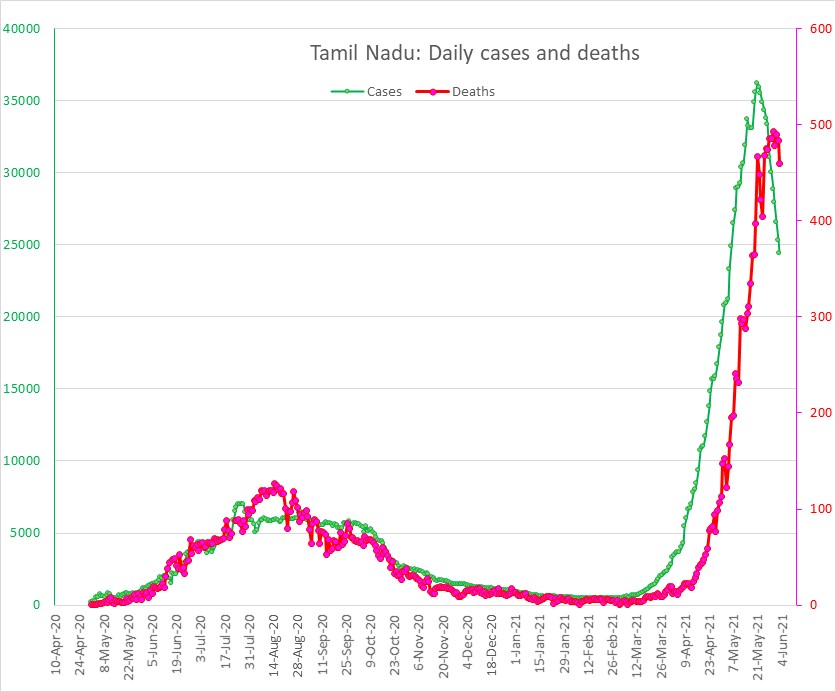
Figure 7: Tamil Nadu cases and deaths