RBI Data Lab: Learning India’s Economy
About the program
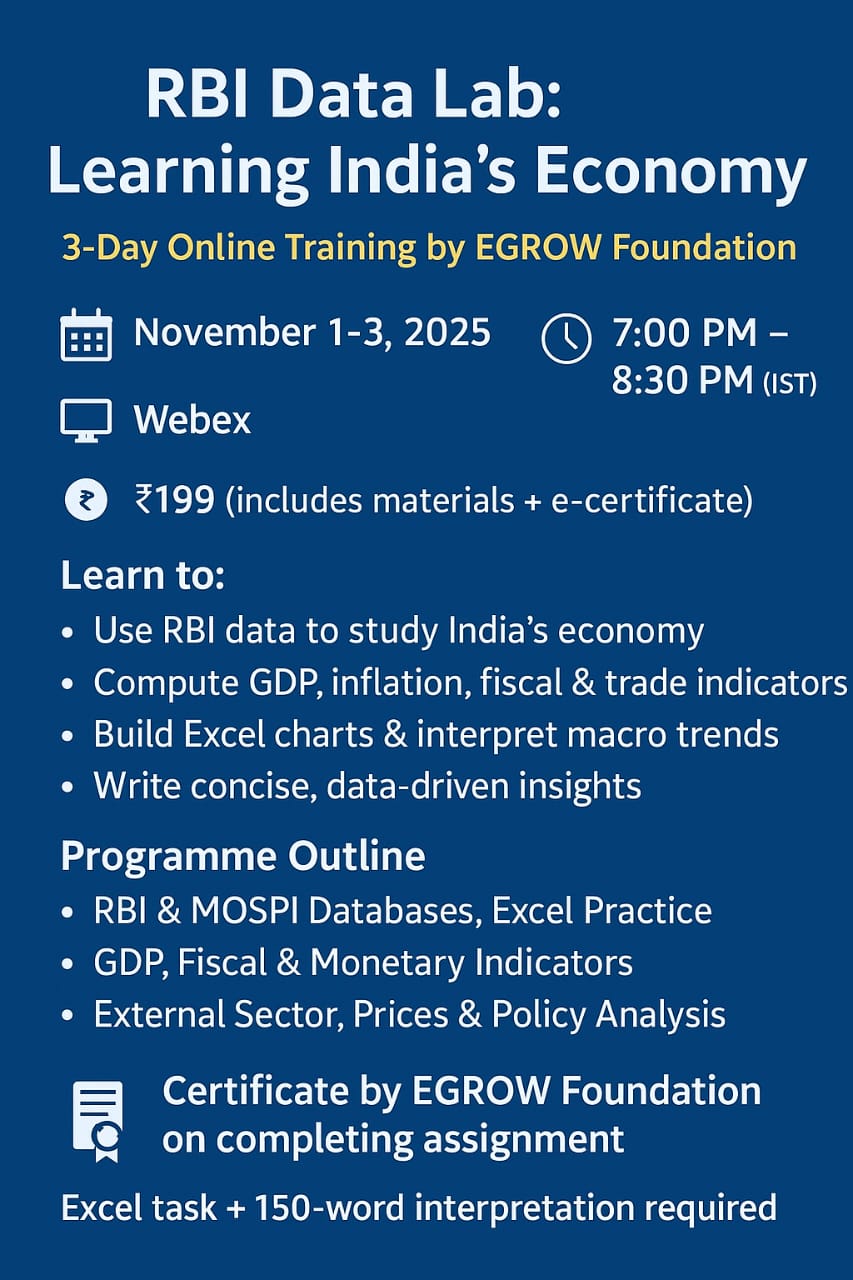
The RBI Data Lab: Learning India’s Economy is a 3-day online training program by EGROW Foundation, designed to teach Economics students how to analyze and interpret real-world macroeconomic data. Using authentic datasets from the RBI and other sources, participants will gain hands-on experience with Excel to compute key indicators like GDP, inflation, and trade balance. The program focuses on building data literacy and understanding economic trends to inform policy decisions, aligning with the NEP’s emphasis on applied economics and experiential learning.
Programme Objectives
- Introduce students to authentic macroeconomic data from RBI’s Handbook of Statistics on the Indian Economy and Handbook of Statistics on States of India.
- Provide hands-on experience in Excel-based data handling, charting, and macroeconomic interpretation.
- Enable computation and analysis of key indicators — GDP growth, fiscal deficit, money supply, trade balance, and inflation.
- Build data literacy and policy analysis skills aligned with the NEP’s emphasis on experiential learning and applied economics.
Key Details
- Assignment: Submit one Excel sheet and a short interpretation note (150 words).
- Certificate: Issued by EGROW Foundation upon successful completion.
- Fee: ₹199 (includes e-certificate and training materials).
- Registration Link: To be shared by EGROW Foundation.
- Mode: Online
- Duration: 3 Days × 1.5 hours per session
Three-Day Schedule
Day 1 (Saturday, November 1, 2025) – Understanding India’s Macro Data
Content:
- Overview of key data sources: RBI, MOSPI, and Budget documents.
- Navigating RBI Handbooks (national and state-level).
- Key macro terms: GDP, GVA, Fiscal Deficit, Repo Rate, CPI.
- Excel Exercise: Download GDP and Trade data; compute simple growth rates and prepare basic charts.
Day 2 (Sunday, November 2, 2025)– National Income, Fiscal and Monetary Indicators
Content:
- GDP and GVA trends — current vs constant prices.
- Fiscal indicators: Receipts, Expenditure, and Deficit.
- Monetary data: M1, M3, CRR, Repo, Reverse Repo.
- Excel Exercise: Create combo charts for fiscal indicators; compute growth and deficit ratios.
- Discussion: Interaction between fiscal and monetary policy.
Day 3 (Monday, November 3, 2025)– External Sector, Prices and Policy Interpretation
Content:
- External sector: Exports, Imports, Trade Balance, Forex Reserves.
- Prices: CPI, WPI, and Inflation trends.
- Excel Exercise: Correlation and visualization — Inflation vs Repo Rate; Trade Balance vs Reserves.
- Group Presentations: Each group presents one chart and three insights.
- Wrap-up: Discussion on India’s macroeconomic trends and data-based policy understanding.
Key Takeaways
- Learn to access and analyze RBI macroeconomic data.
- Compute and visualize key economic indicators in Excel.
- Interpret data trends within a macro policy framework.
- Receive a certificate of participation from EGROW Foundation.
Attendance is compulsory failing which no certificates will be issued.